
Introduction#
When I first started exploring trading, the charts looked like a foreign language. Candlesticks, moving averages, strange indicators—I had no idea where to begin. One of the first concepts that actually made sense to me, though, was support and resistance trading.
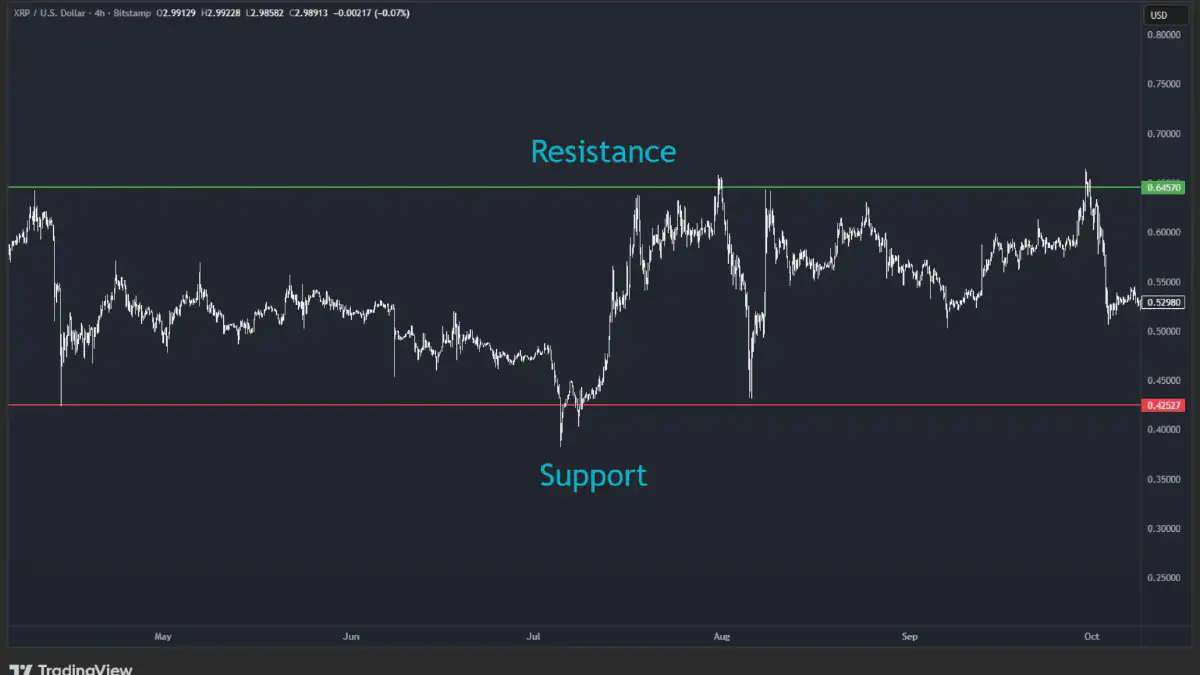
Think of them like the floor and ceiling of a house. Prices tend to bounce off the floor (support) and struggle to break through the ceiling (resistance). Once I understood that, I realized I didn’t need to predict the market—I just needed to react to what the market was already showing me.
In this article, I’ll explain what support and resistance levels are, how to draw them, why they matter, and how you can use them in your trading toolkit. Whether you’re trading crypto, stocks, or forex, these levels are universal.
What Are Support and Resistance Levels?#
Support explained#
Support is the level where an asset’s price tends to stop falling. Buyers see value at that level and step in, creating demand. You can think of it as the “floor” where price action often bounces upward.
For example: if Bitcoin keeps falling to $30,000 and bouncing back up, that’s a support level.
Resistance explained#
Resistance is the opposite. It’s the “ceiling” where price struggles to move higher because sellers step in. Every time the price reaches that point, selling pressure builds.
Example: if Ethereum keeps hitting $2,000 and dropping, that’s a resistance level.
Why they form#
These levels form because of human psychology. Traders remember price points where buying or selling worked before, and they place new orders around those levels. Over time, these levels strengthen and attract even more attention.
Why Support and Resistance Matter in Trading#
When I first started out, I thought technical analysis was about predicting the future. The truth is, trading is about probabilities and risk management. Support and resistance give you a framework for both.
- Anticipating price movement: If an asset approaches support, I know it might bounce. If it approaches resistance, I know it might reverse.
- Setting entry points: These levels help me decide when to buy or sell.
- Managing risk: I can place stop losses just below support or just above resistance to protect my capital.
- Planning trades: They give structure instead of leaving me guessing.
👉 Personal story: I once ignored a clear resistance level on XRP. I bought in late, right before price got rejected. Within hours, I was underwater. That trade taught me never to ignore resistance again.
How to Draw Support and Resistance#
Here’s how I approach it step by step:
1. Identify swing highs and lows#
Look for areas where price repeatedly bounces or gets rejected. These turning points often mark important levels.
2. Use horizontal lines#
Mark lines across those swing highs (resistance) and swing lows (support). Don’t overcomplicate it—simple horizontal lines work best.
3. Check multiple timeframes#
A support level on the daily chart carries more weight than one on the 5-minute chart. Always zoom out to confirm.
4. Watch round numbers#
Humans like round numbers: $1,000, $10,000, $50,000. These often act as psychological support or resistance.
Tools you can use#
- TradingView: My go-to for drawing levels.
- Binance, MT4/5, Bybit: Most platforms offer basic drawing tools.
Common mistakes#
- Drawing too many lines. Keep your chart clean.
- Treating levels as exact. They’re zones, not razor-thin lines.
- Ignoring timeframe context.
Support and Resistance vs Supply and Demand#
Some traders confuse support/resistance with supply/demand. They’re related but not the same.
- Support/resistance: specific levels where price historically reacts.
- Supply/demand: broader zones where large amounts of buying or selling occur.
Think of supply and demand as the “area,” while support and resistance are the “exact points.”
👉 Example: A stock might have a demand zone between $45–$50, but the strongest support level could be $47.
Both concepts complement each other. If I see support aligning with a demand zone, that level becomes extra strong in my analysis.
Types of Support and Resistance#
Static vs Dynamic#
- Static levels: Fixed horizontal price levels, like $30,000 BTC support.
- Dynamic levels: Moving with the market, such as trendlines or moving averages.
Major vs Minor levels#
- Major levels: Formed over months/years; very significant.
- Minor levels: Formed in shorter timeframes; good for day trading.
Psychological levels#
Round numbers like $1,000, $10,000, $100,000. Markets naturally gravitate toward them.
Historical highs/lows#
All-time highs or lows act as strong barriers. Traders remember them for years.
Trading Strategies Using Support and Resistance#
Here are some simple strategies I’ve used and refined:
1. Bounces#
- Buy at support when price touches and shows signs of holding.
- Sell at resistance when price gets rejected.
2. Breakouts#
When price finally pushes through a strong level, momentum can build fast.
- Buy a breakout above resistance.
- Sell a breakdown below support.
3. Fakeouts (False Breakouts)#
Markets often trick traders by briefly breaking a level and snapping back.
- Always confirm with volume.
- Wait for a retest before committing.
4. Combining with other indicators#
- RSI: Helps confirm overbought/oversold conditions.
- MACD: Confirms momentum shifts.
- Volume: Confirms breakout/breakdown strength.
5. Risk/reward planning#
If support is $30,000 and resistance is $32,000, I might risk $500 for the chance to gain $1,500—a solid risk/reward ratio.
Common Mistakes Beginners Make#
I’ve made most of these mistakes myself, so I’ll share them so you don’t have to:
- Over-reliance: Treating support/resistance as guaranteed outcomes. Nothing is certain in trading.
- Ignoring context: Levels work best with broader analysis (trend, volume, sentiment).
- Cluttering charts: Too many lines = confusion.
- Forgetting levels shift: Once broken, support can become resistance and vice versa.
Advanced Insights#
If you want to take things further, here are some deeper concepts I’ve studied:
- Liquidity zones: Big players (institutions, whales) hunt liquidity near support and resistance.
- Order blocks: Areas where large buy/sell orders were executed, often creating future levels.
- News and sentiment: Fundamentals can override technicals, but levels still provide context.
For example, during a major news event (like Bitcoin ETF approval), price might smash through resistance. But that resistance often becomes support later.
FAQs#
What is support and resistance in simple terms? Support is the floor where price stops falling; resistance is the ceiling where price struggles to rise.
How do you identify support and resistance levels on a chart? Look for repeated bounces or rejections, draw horizontal lines, and confirm across multiple timeframes.
Is support and resistance reliable in crypto trading? Yes, but they’re not foolproof. Crypto is volatile, so use them with risk management.
What’s the difference between support/resistance and supply/demand? Support/resistance are exact levels; supply/demand are broader zones.
Do support and resistance levels always work? No. They increase probabilities, but nothing works 100% of the time.
What indicators confirm support and resistance? RSI, MACD, and especially volume can help confirm if levels hold or break.
How often should I redraw support and resistance lines? Whenever market structure changes significantly—new highs/lows, or when old levels break.
Why Support and Resistance Should Be Part of Your Trading Toolkit#
I’ve tried dozens of indicators over the years. Some work in certain markets, others don’t. But support and resistance levels are timeless.
Here’s why I believe every trader should use them:
- They reveal market psychology—where buyers and sellers step in.
- They provide structure to otherwise chaotic charts.
- They’re useful across all assets: crypto, forex, stocks, commodities.
- They help reduce emotional trading, giving you a plan instead of impulse.
No matter your strategy—day trading, swing trading, or long-term investing—support and resistance levels deserve a permanent place in your toolkit.
Conclusion#
Support and resistance aren’t magic. They’re not about predicting the future. Instead, they’re a way of reading what the market has already shown you and using that to your advantage.
By practicing how to identify these levels, you’ll start to see the market less as noise and more as a map of human behavior. And once you master them, you’ll trade with more confidence and less stress.
👉 My challenge to you: open a chart today, pick any asset, and mark at least three support and resistance levels. Watch how the price reacts over the next week. You’ll be surprised how often these levels matter.
Disclaimer#
I am not a financial adviser, and this article is for educational purposes only. Trading and investing involve risk, and you should do your own research or consult a licensed financial professional before making investment decisions.